Multi-Sensor Environmental Monitoring System
A Zynq SoC system that reads formaldehyde, particulate-matter and temperature sensors and shows the same readings on an OLED screen, a Bluetooth phone terminal and a browser dashboard.
- Period
- Mar–Jul 2026
- Context
- Zynq FPGA/ARM course project
- Team
- Team of 3
- My role
- Sensor interfaces, processor software, Bluetooth and web outputs
- Status
- Completed course project with a full hardware-to-display demonstration
Demo & artifacts
- Open demoSimulated data
The board's processor code, compiled unmodified to WebAssembly, runs against simulated sensors and FPGA logic, and the project's original web dashboard connects to it over a virtual Bluetooth port. A second, smaller demo isolates the data-quality rules. Neither connects to real hardware.
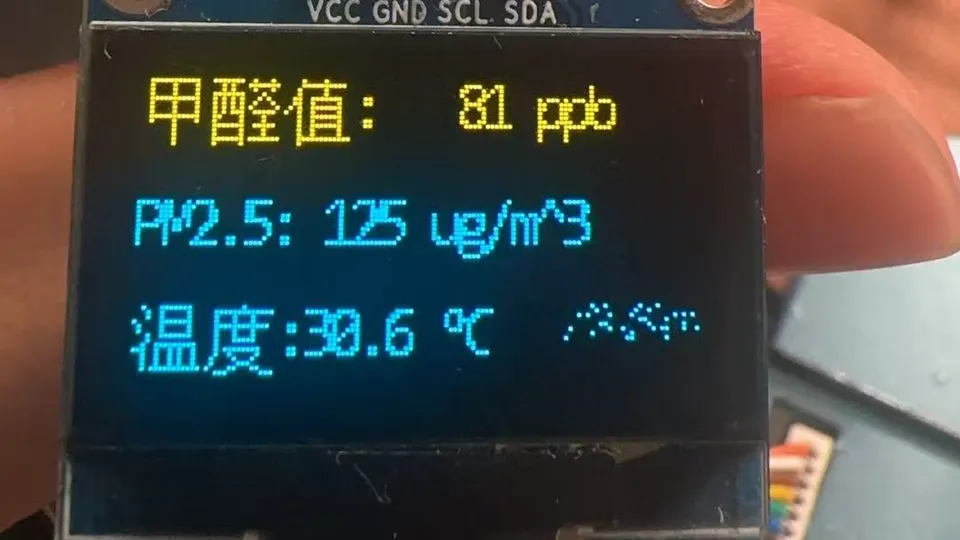
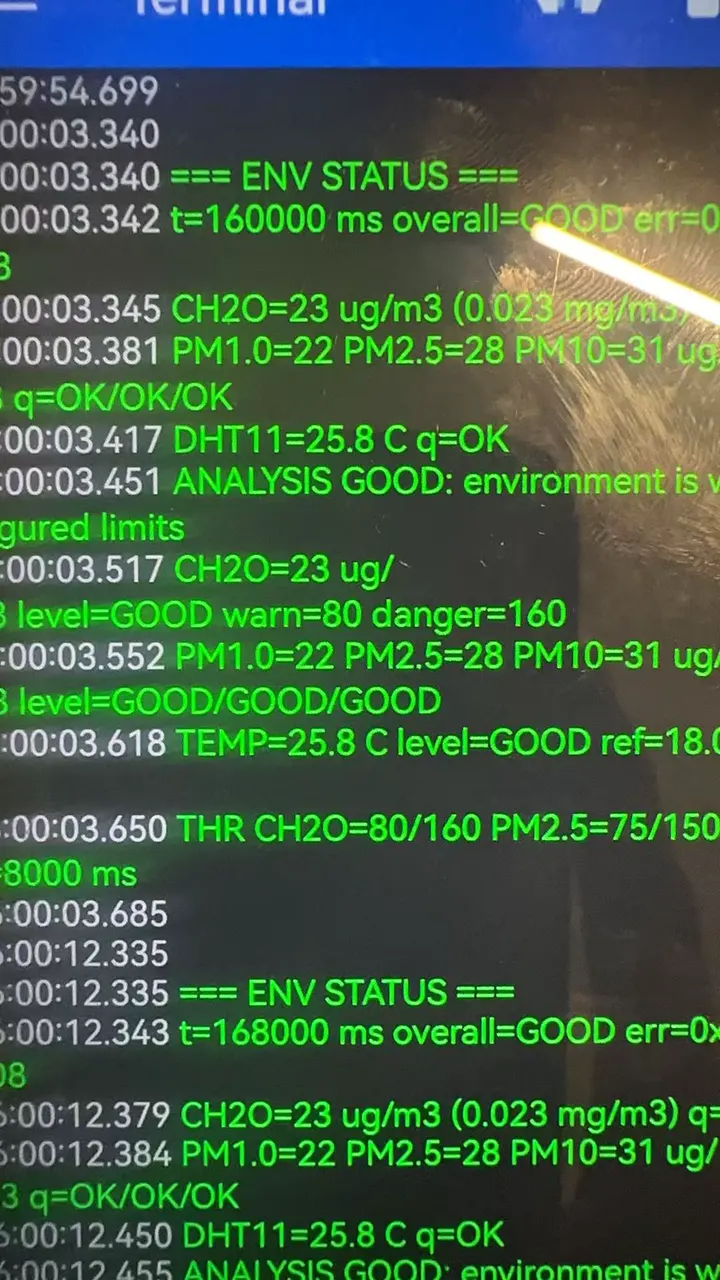
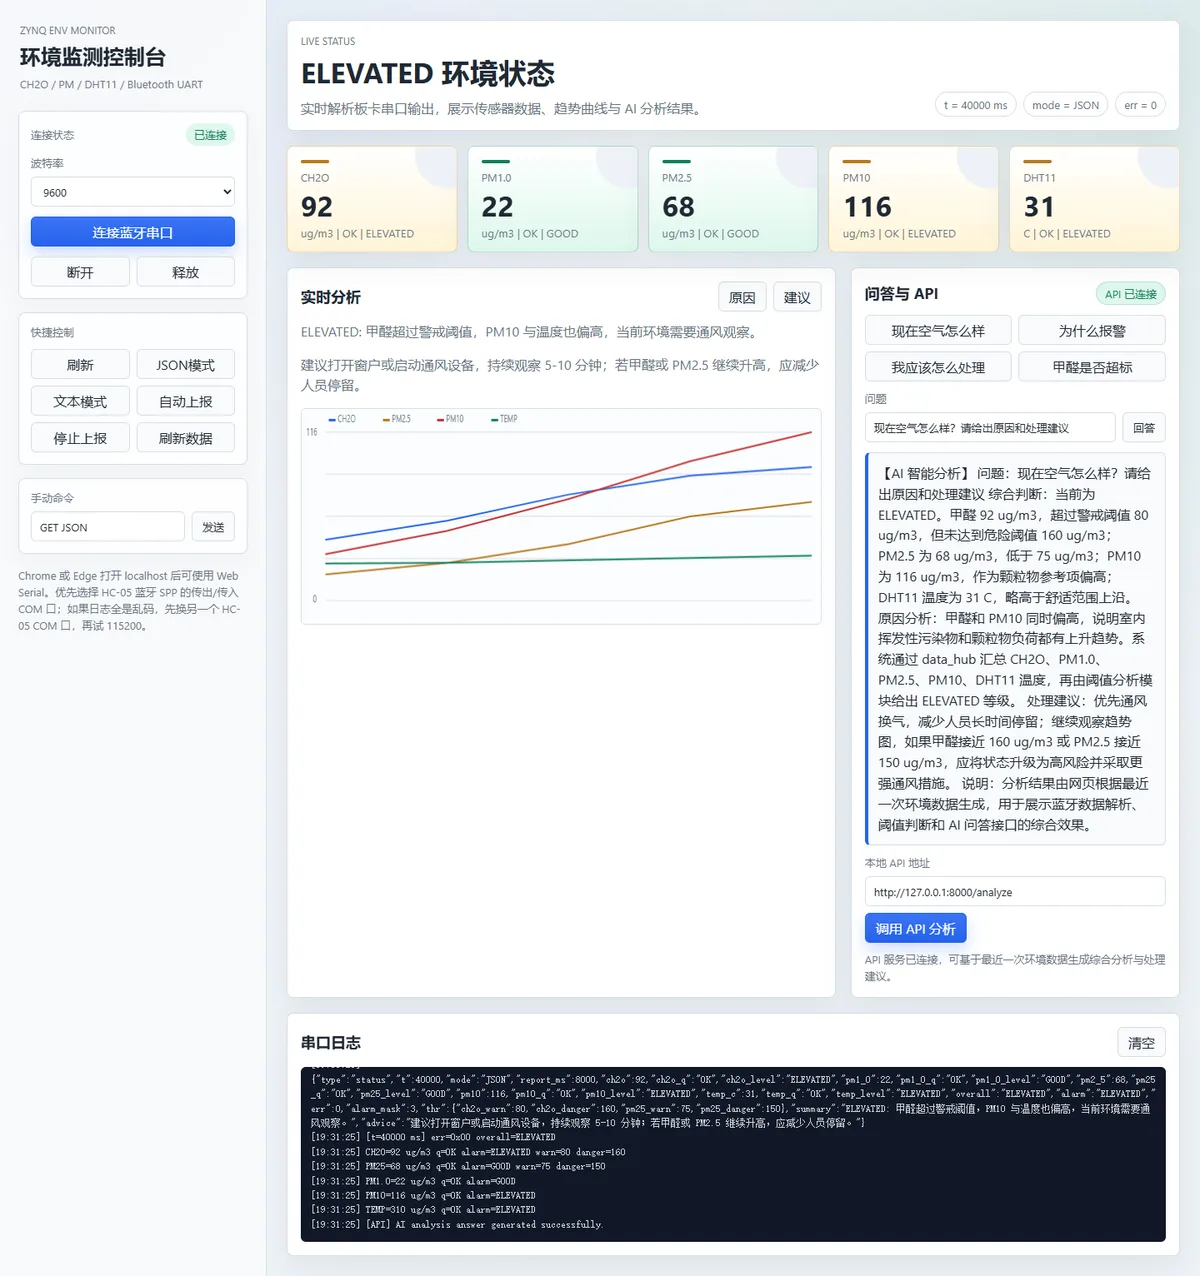
My contribution
- Implemented a custom AXI IP with AXI4-Lite registers and integrated the formaldehyde (ZE08-CH2O) and particulate (ZH03B) sensors. Their frames are synchronised and checksum-verified in the FPGA fabric before the processor reads them.
- Wrote the processor-side application in C: central address and threshold configuration, register drivers, sensor parsers, a shared
data_hub, threshold analysis and a polling scheduler (100 ms loop, 500 ms sensor polls). - Built two outputs on top of the hub: a Bluetooth protocol over AXI UARTLite and an HC-05 module (text commands such as
STATUSandTHR SET, one-line JSON reports, binary frames checked with CRC-8), and a browser dashboard that reads the same link through the Web Serial API. - Designed the WARMUP / OK / STALE / ERROR / INVALID data-quality states and the 5,000 ms staleness rule, after working through the sensor timing with my instructor and a classmate.
Teammates built the OLED display IP and the DHT11 sampling IP. I wrote the software interfaces that connect both to the shared data hub.
How it works
The work is split by what each side does well. The FPGA fabric handles fixed-timing work: it receives UART bytes, finds frame boundaries and checks checksums, and a failed frame does not overwrite the last good value. The ARM processor handles the flexible logic. It polls the sensor registers every 500 ms, records each reading in data_hub with a quality state, timestamp and sequence number, evaluates thresholds, and serves the outputs.
Each output reads from the hub rather than from another output. The OLED adapter receives a compact snapshot instead of the whole hub, so changing a Bluetooth command never touches display code, and a teammate could develop the display independently.
A problem I solved: stale readings that looked live
During testing, the system could keep showing a sensor’s last value after that sensor had stopped delivering frames. A number on a screen gives no hint of its age, so an old reading looked current.
After rereading the sensor datasheets, I worked through the timing with my instructor and a classmate, and we decided to track freshness explicitly:
- Every sample carries
quality,timestamp_msandsequence. It starts as WARMUP and becomes OK on the first valid read. - On every loop iteration,
data_hub_tickmarks an OK sample STALE once more than 5,000 ms have passed since its last valid update. That is ten 500 ms polling periods, so one or two missed polls do not trigger it. The three PM values come from one frame, so a stale PM2.5 marks PM1.0 and PM10 stale as well. - The alarm logic ranks a STALE or ERROR sample as a sensor error, above DANGER, and the OLED adapter writes 0 for any sample that is not OK. Every output therefore shows that data is missing for any sample the processor recognises as stale, instead of repeating an old number.
The core of the rule, from the archived source (lightly trimmed):
void data_hub_tick(env_monitor_data_t *hub, u32 now_ms)
{
    if ((hub->ch2o.quality == DATA_QUALITY_OK) &&
        ((now_ms - hub->ch2o.timestamp_ms) > SENSOR_STALE_TIMEOUT_MS)) {
        hub->ch2o.quality = DATA_QUALITY_STALE;
        hub->system.error_flags |= PLATFORM_ERR_CH2O_TIMEOUT;
    }

    if (env_monitor_sample_is_stale(&hub->pm25, now_ms) != 0) {
        /* PM1.0, PM2.5 and PM10 share one sensor frame. */
        env_monitor_mark_stale(&hub->pm1_0);
        env_monitor_mark_stale(&hub->pm25);
        env_monitor_mark_stale(&hub->pm10);
        hub->system.error_flags |= PLATFORM_ERR_PM25_TIMEOUT;
    }
    /* DHT11 temperature follows the same rule. */
}
The rule depends on one assumption: the processor must be able to tell a new frame from a register that still holds the previous one. Running the firmware on the virtual board showed that the archived build does not meet it for either UART sensor. The formaldehyde IP latches its valid bit after the first good frame, and the PM path reads its registers without the valid flag (a one-clock pulse the 500 ms poll would almost never see). Both IPs keep the last value, so an unplugged sensor is re-read as fresh every poll and never goes STALE. Only the DHT11 driver, which clears a done bit after each read, sees missing data, and temperature is not part of the overall alarm. Fixing this is the first item under next steps.
Results & validation
- Delivered a complete hardware-to-display demonstration. The same sensor readings appeared on the OLED screen, the phone Bluetooth terminal and the browser dashboard (see the photos and screenshot above).
- The final course report records a behavioural simulation of the formaldehyde frame parser (
tb_ze08_ch2o) and register-level checks of the PM1.0, PM2.5, PM10 and status registers. - The phone terminal photo shows reports about 8 s apart, matching the default
BT_REPORT_PERIOD_MSof 8,000 ms, with every value markedq=OK. - For this website I compiled the processor code, unchanged, to WebAssembly and ran it against a simulated board: Verilog-accurate models of the two UART sensor IPs, modelled DHT11 and OLED IPs, and the 16-byte UART FIFO. The project's own dashboard connects to it and works as on the bench.
- The [data-quality demo](/demos/environment-monitor/) isolates the staleness rule and the alarm ranking: stopping a sensor turns its readings STALE after 5 s. Running the real firmware on the simulated board showed that, in the archived build, only the DHT11 path actually reaches that state (see limitations).
These are records from the original course submission in 2026. The board was not re-tested for this website, and the photos are archived evidence of the system working, not calibrated measurements.
Limitations & next steps
- Units: the formaldehyde IP outputs the ZE08's concentration in ppb (frame bytes 4–5, as its Verilog comments say), but
ze08_ch2o_read_ip_samplestores that number as µg/m³ and divides it by 1.23 to get ppb. The reported µg/m³ values are therefore the ppb reading, about 19 % low, and the 80/160 thresholds are compared against ppb. The OLED, which labels the same number ppb, is right. Fix: convert ppb to µg/m³ in the driver, as the active-upload parser already does. - New-data detection: neither UART sensor can go STALE in the archived build (latched formaldehyde valid bit; PM registers read without the valid pulse), so an unplugged sensor's last value stays OK. Next step: a frame counter or a new-data bit in each IP that the processor clears on read, so freshness does not depend on polling timing.
- UART receive FIFO: the AXI UARTLite buffers 16 bytes and the firmware empties it once per 100 ms loop. At 9600 baud a longer burst, including the dashboard's own MODE JSON + GET JSON on connect (21 bytes), can lose its tail; in the simulation the GET JSON is usually cut off and data arrives with the next 8 s report. This depends on timing and should be checked on the board. Fix: poll the UART from an interrupt, or drain it more often than every 100 ms.
- The thresholds (CH2O 80/160, PM2.5 75/150 µg/m³) are demonstration settings, not health or regulatory limits, and the sensors were not calibrated.
- Only DHT11 temperature is integrated, not humidity. The Bluetooth commands have no authentication, which is acceptable for a classroom demo only.
- The loop clock adds a fixed period per iteration instead of reading a hardware timer, so long runs drift. Protocol edge cases (truncated frames, bad CRC, over-long lines) should get automated tests.
Run / reproduce
Environment
- Zynq SoC development board with ZE08-CH2O, ZH03B, DHT11, OLED and HC-05 modules
- Vivado for the hardware platform and Vitis for the processor application
- Chrome or Edge for the Web Serial dashboard
Steps
- Build the hardware platform in Vivado, export it, and build the
envmonitor_test_pollingapplication against it in Vitis. - Program the board and open the USB debug console at 115200 baud to see the once-per-second status report.
- Pair a phone with the HC-05 module and open a serial terminal at 9600 baud. Send
HELP, thenPINGto check both directions, thenSTATUSorGET JSON. - Optionally open the dashboard in Chrome or Edge, connect to the HC-05 serial port, and send
MODE JSONfor machine-readable reports.
Without the hardware, the browser demo shows the data-quality behaviour with simulated data.