CUMCM 2025: NIPT Timing
Modelled Y-chromosome concentration against gestational age and BMI to recommend NIPT testing windows for male fetuses, with Bayesian estimates, K-means BMI groups and a Monte Carlo robustness check, and compared three classifiers for chromosome anomalies in female fetuses.
- Period
- September 2025
- Context
- China Undergraduate Mathematical Contest in Modeling
- Team
- Team of 3
- My role
- Team member (modelling and analysis)
- Status
- Paper submitted within the contest; Second Prize, Beijing Division
- Recognition
- Second Prize, Beijing Division, CUMCM 2025
Demo & artifacts
- Open demoSimulated data
The explainer uses the risk function, objective and procedures from our paper and shows its results for both problems. The contest's patient data is not published, so the parts that need data run on a synthetic group of women and are marked as illustrative.
My contribution
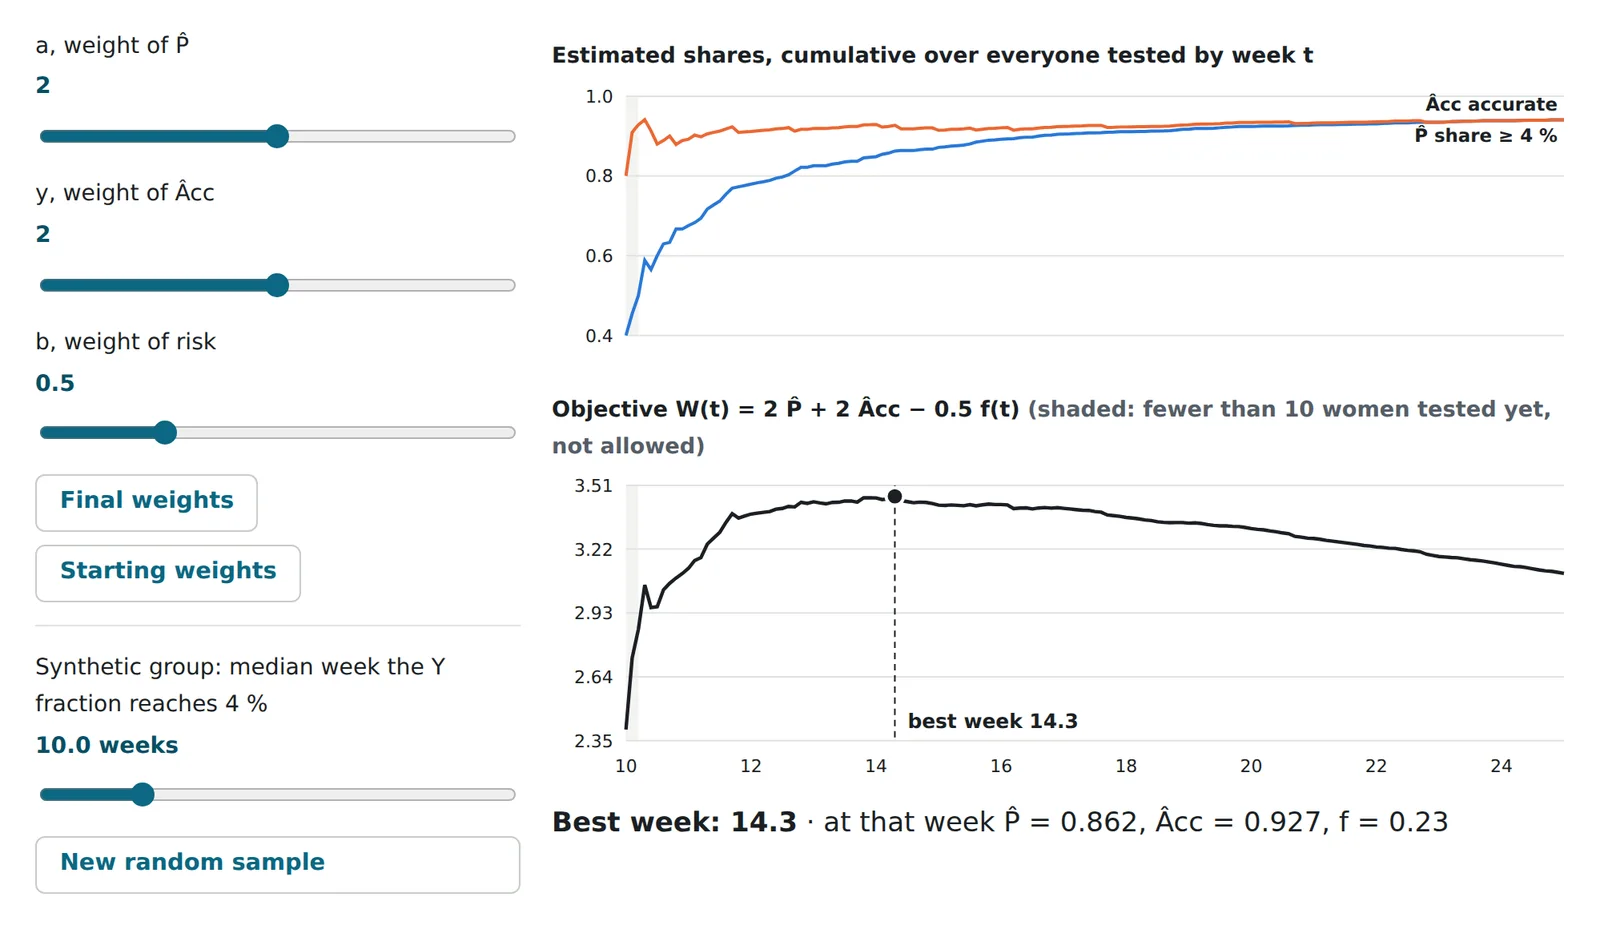
- Problem 2: scored each candidate testing week with W(t) = a P̂ + y Âcc − b f(t), where P̂ and Âcc are Beta-binomial posterior means of the share with a Y fraction of at least 4 % and the share of correct results, and f(t) is a piecewise linear penalty for late detection. Estimated each woman's best week from women within ±0.5 of her BMI, scanning 10–25 weeks in 0.1-week steps.
- Grouped the women with K-means on (BMI, individual best week), turned the clusters into five whole-number BMI intervals and checked the spread within each group (coefficient of variation).
- Problem 3: built a composite score from random-forest importances of gestational week, BMI, age, height and weight, clustered (BMI, score) into three groups with cut-offs at the midpoints between cluster means, and designed a 1,000-run Monte Carlo check with 5 % relative noise on the concentration and random flips of diagnoses.
- Problem 4: compared a random forest, a logistic regression on the strongest features and a decision tree for detecting T13, T18 and T21 in female fetuses.
The paper and the award belong to the three-member team. The contributions listed are the parts I describe on my CV.
The problem
Contest problem C asked when pregnant women should have NIPT, a blood test that screens for chromosome disorders using fetal DNA. For a male fetus the result counts as reliable once the Y-chromosome fraction reaches 4 %, and that happens later in women with a higher BMI. Testing too early risks an unreliable result; testing too late shortens the time to act on a bad one. The team had to group women by BMI, recommend a testing week for each group, check how measurement error affects the answer, and build a way to spot chromosome anomalies in female fetuses, where there is no Y chromosome to measure.
Approach
Problem 2 turned the trade-off into a score for each candidate week: a weighted sum of the estimated share of women whose Y fraction had reached 4 % and the share of correct results, minus a penalty that grows after 12 weeks and faster after 28. Both shares are Beta-binomial posterior means, so a week supported by only a handful of women cannot win by luck. Each woman got an initial best week from women of similar BMI, and K-means on (BMI, best week) produced the groups. Problem 3 replaced BMI alone with a composite score built from random-forest importances and tested the robustness of the result with simulated measurement and diagnosis errors. Problem 4 used a random forest to rank 18 features and compared it with a logistic regression and a decision tree.
The explainer lets you move the weights and watch the recommended week respond, and runs the robustness check on synthetic data.
Results & validation
- Problem 2: five BMI groups with recommended testing weeks between 12.0 and 15.5 (table in the explainer).
- Problem 4: the random forest reached 0.922 accuracy and AUC 0.957 on the test set. The decision tree overfitted (AUC 0.971 in training, 0.825 in testing). The logistic regression found X-chromosome concentration and the GC content of chromosomes 13 and 21 significant.
- The paper won a Second Prize in the Beijing Division.
Figures come from the team's working drafts of the problem 2–4 sections. The submitted paper, the contest data and the code were not available to me for this page, so final figures may differ. The explainer's synthetic data was generated for this website in November 2026.
Limitations & next steps
- P̂ and Âcc pool every woman tested by week t, not those tested at t. As later tests are added the estimates keep shifting, so W is nearly flat around its peak and the chosen week is sensitive to the sample; the explainer shows this. Modelling the time at which the Y fraction reaches 4 % directly, for example as interval-censored survival data, would answer the question more directly.
- The weights (a = 2, y = 2, b = 0.5) were tuned by hand and the penalty slopes were chosen, not derived; the recommended weeks depend on both.
- For female fetuses only 11.4 % of samples are abnormal, so labelling everything normal already gives 88.6 % accuracy. The reported recall and precision are weighted averages; the share of abnormal cases caught, and the threshold behind it, should have been reported.
- The GC contents of chromosomes 13, 18 and 21 are correlated, which shows in very wide intervals (chromosome 13: odds ratio 28.8, 95 % CI 2.9–289).
- The drafts describe the Monte Carlo check but do not include its results.